Appendix
Spending by Zone and Demographics in Districts We Reviewed
The Joint Legislative Audit Committee requested that the California State Auditor, to the extent possible, identify the current socioeconomic demographics of each district receiving funding and determine the amounts received by those districts in each of the fiscal years from 2010–11 through 2014–15. Our review found that all 12 of Caltrans’ districts received funding in each of the five years we reviewed, as we show in Table 5 in the Audit Results. However, to analyze more precisely where the districts spent their field maintenance funding, we focused on three selected districts: district 4 (Oakland), district 6 (Fresno), and district 7 (Los Angeles). Table A shows the amounts that these districts spent by zone—that includes information on the respective district’s climate and average daily traffic volume—for field maintenance during those fiscal years.
Additionally, we retained a geographic information systems consultant (consultant) to plot on maps each of the three districts’ spending for field maintenance activities. Because we had this detailed spending information for the three districts, we attempted to focus our review of socioeconomic demographics in the three districts as well. Specifically, the consultant identified median income, race, and ethnicity using tract‑level data from the U.S. Census Bureau and displayed that information on maps of each of the three districts. The consultant then overlaid the spending information on the socioeconomic demographic information to allow for comparison. However, when compared with the areas of high and low spending, which we described more fully in the Audit Results, we found no clear correlation between the levels of spending and income levels or race and ethnicity. In particular, we found there were areas of both high and low spending in each of the three districts on highway sections that pass through areas where the income level and race and ethnicity of the majority of the population varies. Figures A, B, and C show the median income by census tract for districts 4, 6, and 7, respectively, as well as the sections of highway with high and low spending. Figures D, E, and F show the race and ethnicity that make up the majority of the population by census tract and also show sections of highway with high and low spending for districts 4, 6, and 7, respectively.
Sources: California State Auditor geographic information system consultant’s analysis of cost data from California Department of Transportation’s (Caltrans) integrated maintenance management system for fiscal years 2010–11 through 2014–15 and Caltrans’ climate region and traffic volume data.
* Calculations of average dollars per mile per zone are weighted for number of miles in each section of the highway.
† Low spending is field maintenance spending more than 50 percent below the average per‑mile spending for the zone.
‡ High spending is field maintenance spending more than 150 percent of the average per‑mile spending for the zone.
– District does not have highways in this zone.
Figure A
Median Income and Field Maintenance Per‑Mile Spending, District 4 (Oakland)
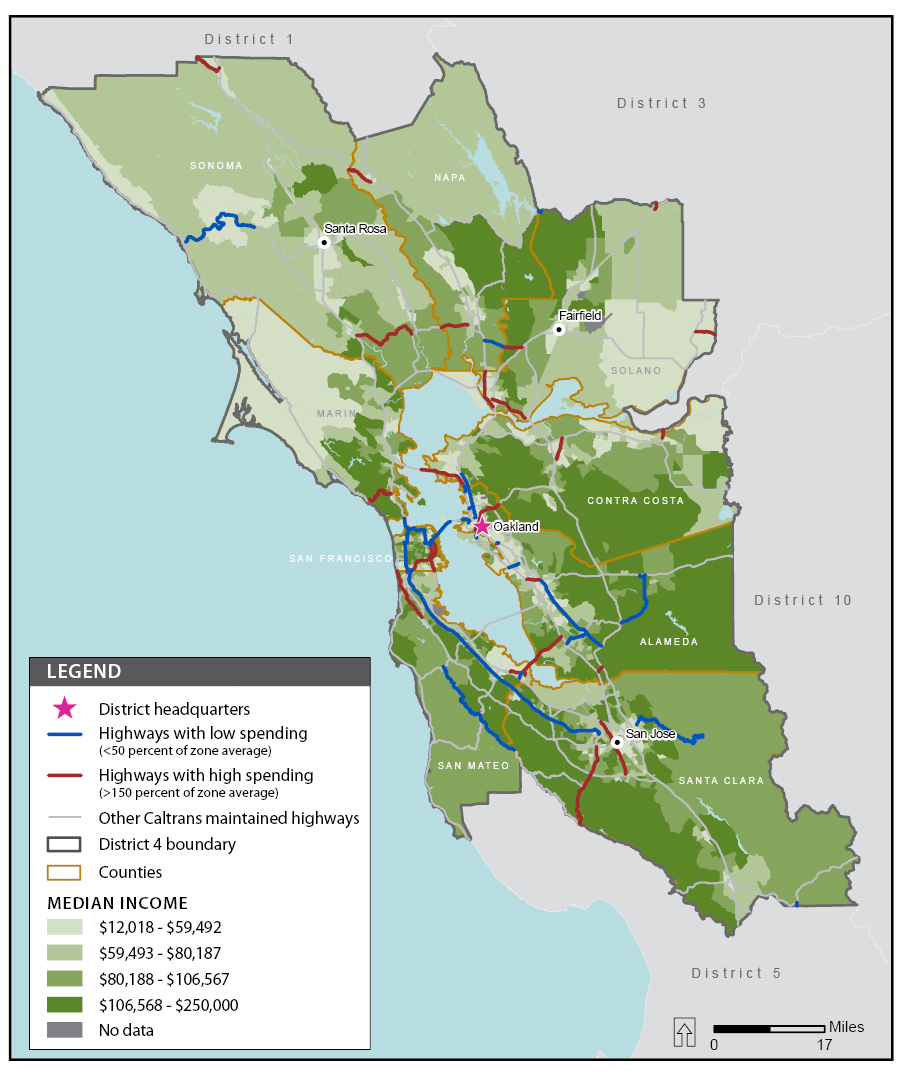
Source: California State Auditor geographic information system consultant’s analysis of cost data from California Department of Transportation’s (Caltrans) integrated maintenance management system for fiscal years 2010–11 through 2014–15 and Caltrans’ climate region and traffic volume data. Median income categories classify the district’s census tracts into four groups of an equal number of tracts based on their distribution of median income using data from the U.S. Census Bureau’s 2009–2013 American Community Survey Five‑Year Estimate.
Figure B
Median Income and Field Maintenance Per‑Mile Spending, District 6 (Fresno)
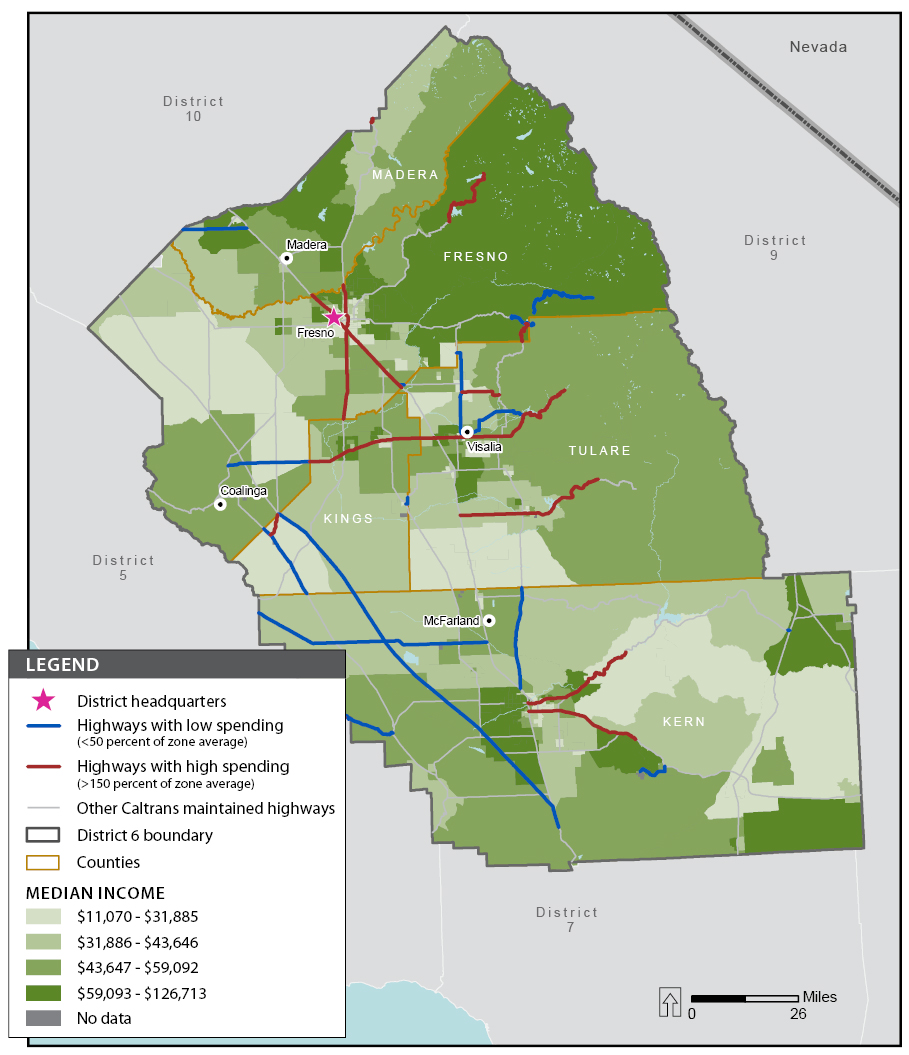
Source: California State Auditor geographic information system consultant’s analysis of cost data from California Department of Transportation’s (Caltrans) integrated maintenance management system for fiscal years 2010–11 through 2014–15 and Caltrans’ climate region and traffic volume data. Median income categories classify the district’s census tracts into four groups of an equal number of tracts based on their distribution of median income using data from the U.S. Census Bureau’s 2009–2013 American Community Survey Five‑Year Estimate.
Figure C
Median Income and Field Maintenance Per‑Mile Spending, District 7 (Los Angeles)
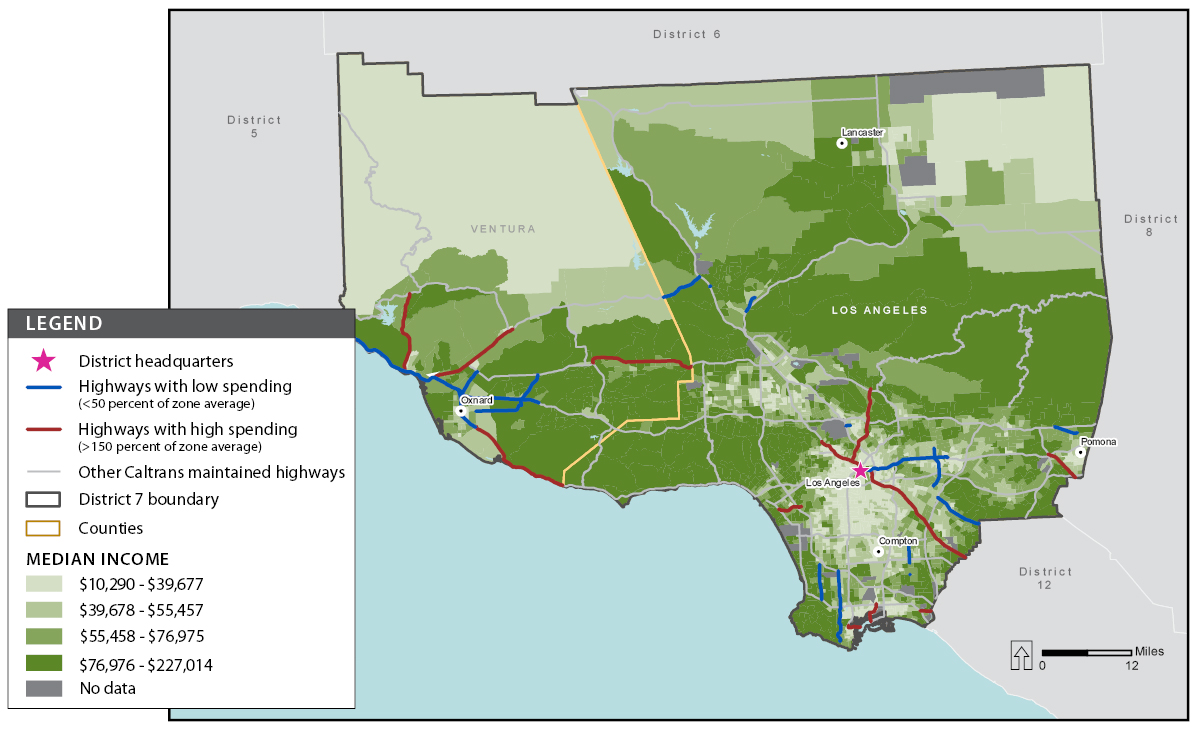
Source: California State Auditor geographic information system consultant’s analysis of cost data from California Department of Transportation’s (Caltrans) integrated maintenance management system for fiscal years 2010–11 through 2014–15 and Caltrans’ climate region and traffic volume data. District median income categories classify the district’s census tracts into four groups of an equal number of tracts based on their distribution of median income using data from the U.S. Census Bureau’s 2009–2013 American Community Survey Five‑Year Estimate.
Figure D
Race and Ethnicity and Field Maintenance Per‑Mile Spending, District 4 (Oakland)
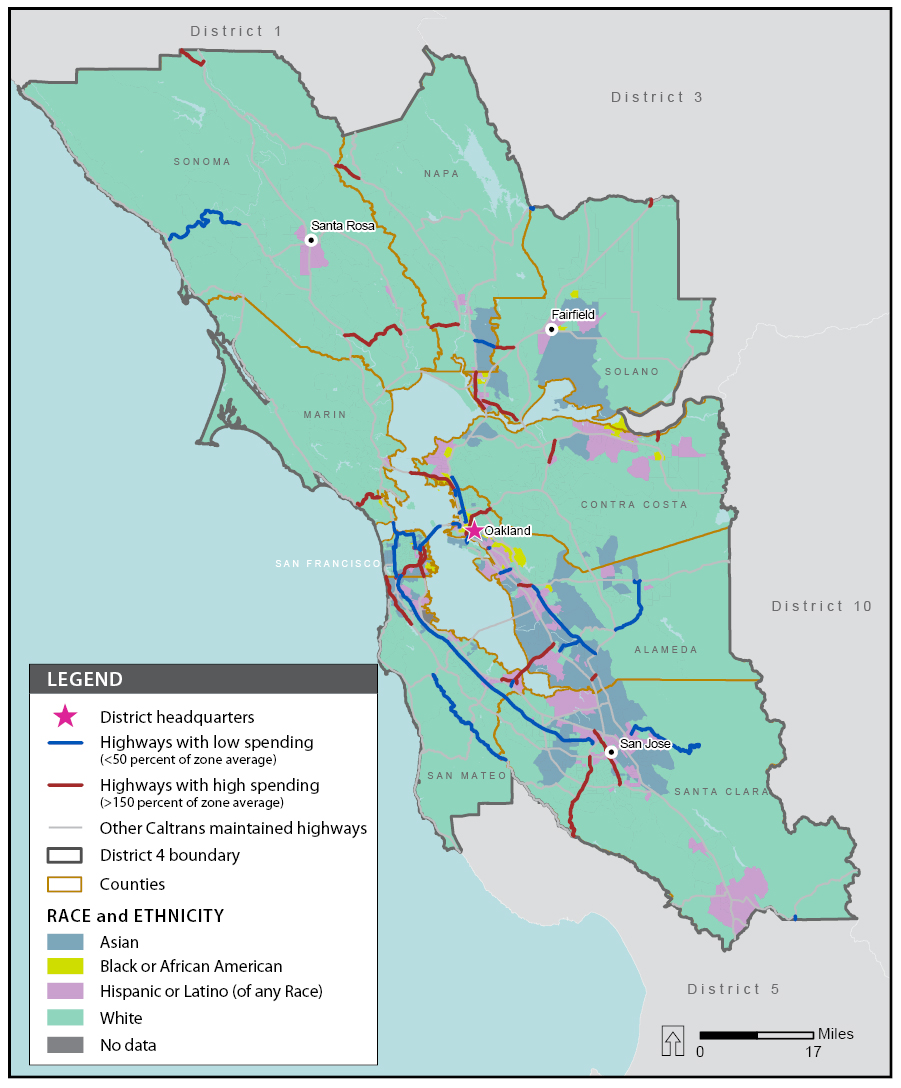
Source: California State Auditor geographic information system consultant’s analysis of cost data from California Department of Transportation’s (Caltrans) integrated maintenance management system for fiscal years 2010–11 through 2014–15 and Caltrans’ climate region and traffic volume data. The consultant also calculated the race and ethnic group that made up the highest percentage of each census tract’s population using data and terms from the U.S. Census Bureau’s 2009–2013 American Community Survey Five‑Year Estimate.
Figure E
Race and Ethnicity and Field Maintenance Per‑Mile Spending, District 6 (Fresno)
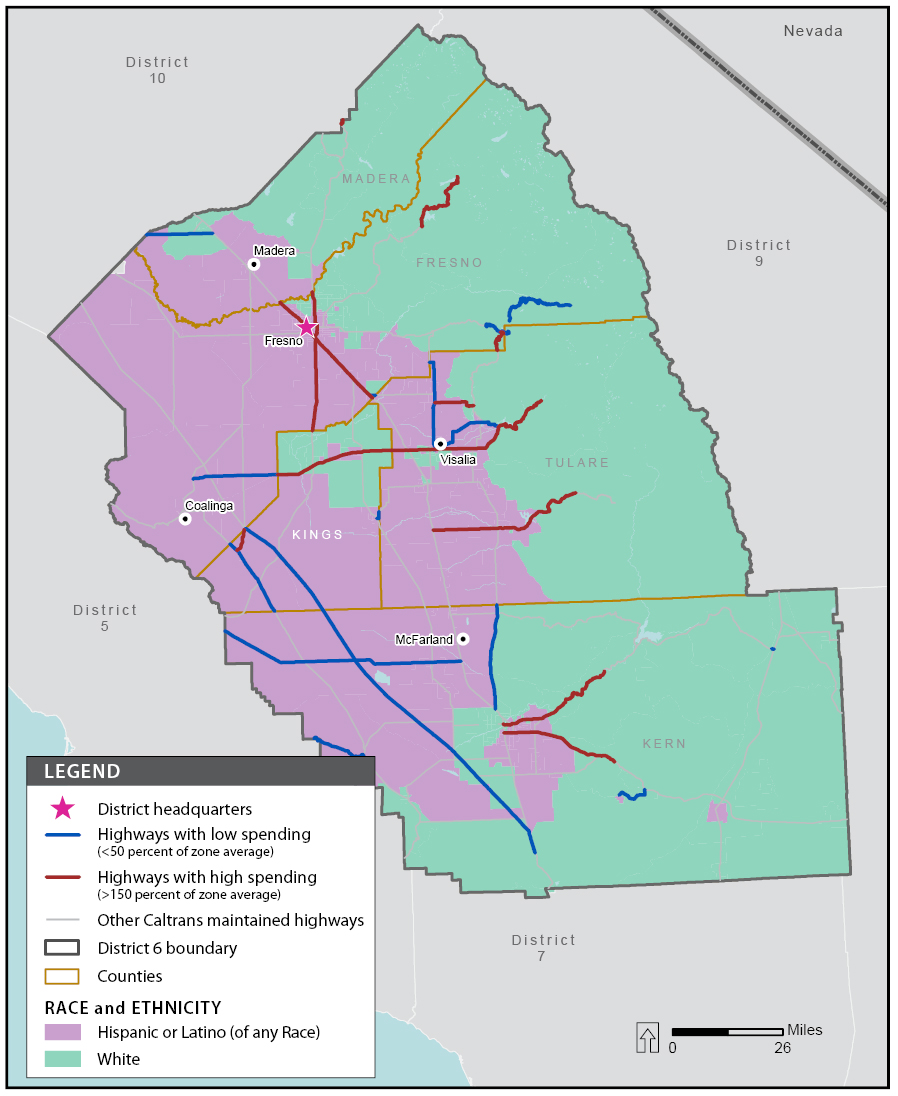
Source: California State Auditor geographic information system consultant’s analysis of cost data from California Department of Transportation’s (Caltrans) integrated maintenance management system for fiscal years 2010–11 through 2014–15 and Caltrans’ climate region and traffic volume data. The consultant also calculated the race and ethnic group that made up the highest percentage of each census tract’s population using data and terms from the U.S. Census Bureau’s 2009–2013 American Community Survey Five‑Year Estimate.
Figure F
Race and Ethnicity and Field Maintenance Per‑Mile Spending, District 7 (Los Angeles)
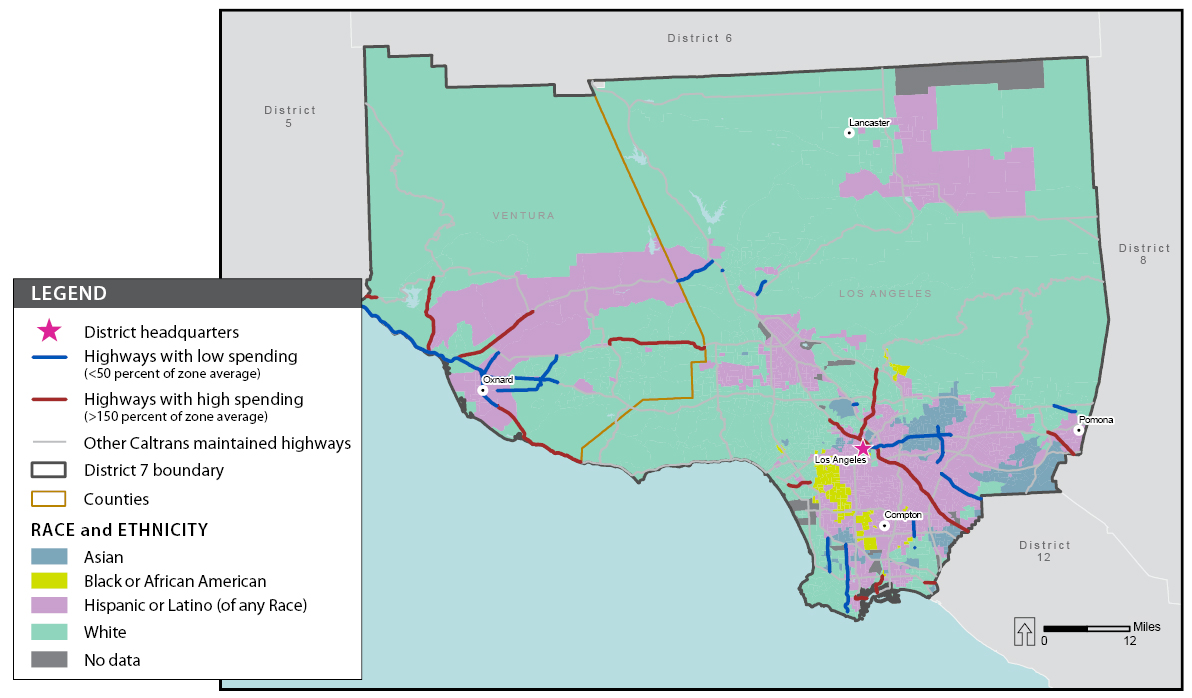
Source: California State Auditor geographic information system consultant’s analysis of cost data from California Department of Transportation’s (Caltrans) integrated maintenance management system for fiscal years 2010–11 through 2014–15 and Caltrans’ climate region and traffic volume data. The consultant also calculated the race and ethnic group that made up the highest percentage of each census tract’s population using data and terms from the U.S. Census Bureau’s 2009–2013 American Community Survey Five‑Year Estimate.