Introduction
Background
The Legislature founded the University of California (university) in 1868 as a public, state-supported, land-grant institution. The California Constitution established the university as a public trust, to be administered by the Regents of the University of California (regents), an independent governing board with full powers of organization and government that is subject to legislative oversight only in certain circumstances. The regents consist of 26 members: 18 members appointed by the governor with the approval of the California Senate; seven ex officio members, including the governor, the speaker of the assembly, and the president of the university; and one student member appointed by the regents.
The head of the university is the president, to whom the regents granted full authority and responsibility over the administration of all the university’s affairs and operations. The university’s Office of the President is the systemwide headquarters of the university. It manages the university’s fiscal and business operations, and it also supports its academic and research missions across its campuses, laboratories, and medical centers. A chancellor at each campus is responsible for managing campus operations. The Academic Senate determines conditions for admission; establishes degree requirements; approves courses and curricula; and advises the university on faculty appointments, promotions, and budgets.
The Master Plan for Higher Education in California
In 1960, the State Board of Education and the regents approved in principle the Master Plan for Higher Education in California (Master Plan), which proposed the roles of the university and the other parts of the system of state-supported postsecondary education in California. The Legislature subsequently passed the Donahoe Higher Education Act, which enacted into law many Master Plan recommendations, such as defining the distinct missions of the three public higher education segments. Over the years, the Master Plan has been updated and the Donahoe Higher Education Act has been amended; however, according to the university, significant principles from the original Master Plan were not enacted into law.
The major features of the Master Plan include the assignment of different functions and different admission pools for the university, the state colleges, and the community colleges. The university is to select from among the top one-eighth (12.5 percent) of the State’s high school graduating class, while the state colleges (the California State University system) are to select from among the top one‑third (33.3 percent). The California Community College system is to admit any resident high school graduate and adult who could benefit from postsecondary instruction. The university’s interpretation of the Master Plan is that it will offer all California residents in the top one-eighth of the statewide high school graduating class who apply on time a place somewhere in the university system but not necessarily at the campus of their choice.
The University’s Funding
The university receives its revenues from a variety of public and private sources. As shown in Figure 1, the university’s revenues totaled over $27.3 billion in fiscal year 2014–15. Some of those sources, among others, included state funding, mostly from the State’s General Fund, which made up about 10 percent of that amount, or $2.8 billion, while student tuition and fees contributed another $3.8 billion. In addition, the university’s five medical centers generated nearly $9 billion. Also, the university received over $1.2 billion in federal funds for the management and operation of three U.S. Department of Energy national laboratories, in addition to the $5.1 billion it received in grants and contracts.
In 2004, the university entered into a compact with the former governor to secure additional state funding to increase its enrollment. However, with the onset of a state financial crisis in 2008, many of the funding increases the State had agreed to in the compact did not take place. Rather, the State reduced its anticipated funding to the university over a period of several years, culminating with a $687 million decrease in fiscal year 2011–12. To offset the state funding it lost, the university took a number of actions, including increasing tuition and student fees and embarking on an initiative of several programs to create efficiencies and generate new revenue. Also, the university began increasing the enrollment of nonresidents to bring in more tuition revenue.
By fiscal year 2012–13, the State’s financial situation had begun to stabilize, and it consequently made no further cuts in its existing funding to the university. In fact, in that year, it provided a funding augmentation of $106 million for the university’s retirement plan, retiree health benefit, and debt service costs. Further, in fiscal year 2013–14, the governor introduced a plan to increase state support to the university by 5 percent per year in fiscal years 2013–14 and 2014–15 and by 4 percent per year in fiscal years 2015–16 and 2016–17. According to the plan, the governor expected that the university would use the funding increases to mitigate the need for tuition and fee increases and to implement reforms to help students progress through college efficiently. However, the university stated that the additional funding was insufficient to cover its mandatory cost increases, most of which related to salaries and benefits, and to support other high-priority costs and investment needs. Nevertheless, the university agreed to the plan.
Figure 1
University of California’s Revenues by Category
Fiscal Year 2014–15
(In Millions)
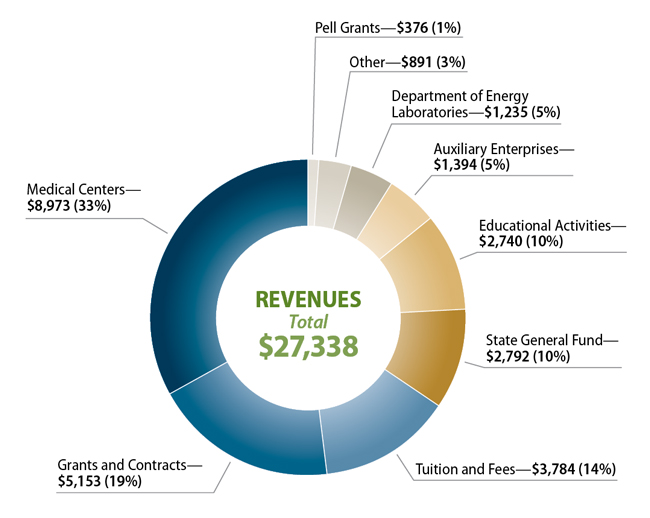
Source: California State Auditor generated based on University of California’s fiscal year 2014–15 audited financial statements.
Note: Excludes nonoperating revenues, such as gifts, investment income, and capital financing, totaling $1.4 billion.
As seen in Figure 2, the university estimates that it used one-half of its $2.8 billion General Fund appropriation in fiscal year 2014–15 for instruction. After instruction, the next two biggest categories of expenditures were academic support—a variety of programs ranging from libraries, academic administration, and clinics—and institutional support, which funds the administrative functions of the campus, the Office of the President, and the regents. The university estimates that it increased the spending of its General Fund appropriation on institutional support by 38 percent between fiscal years 2005–06 and 2014–15. During that same time, the university increased its use of state funding for instruction by 11 percent and reduced its state spending in most other funding categories. The university indicates it began spending $52 million in state funding annually for student financial aid in fiscal year 2012–13.
Figure 2
University of California’s Estimate of How It Spent State General Fund Revenue
Fiscal Year 2014–15
(In Millions)
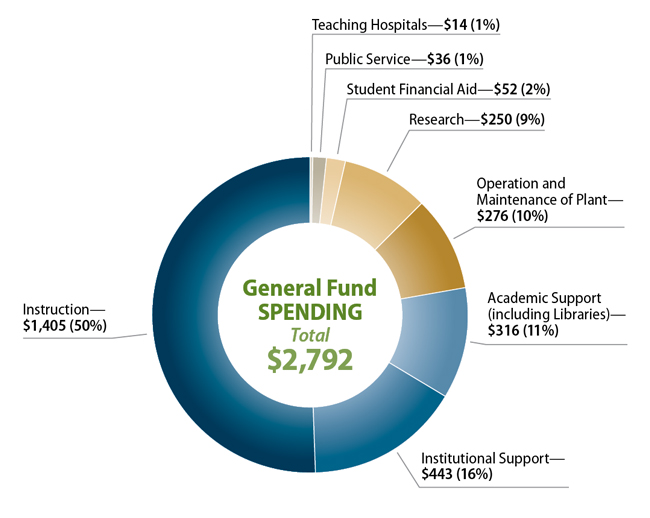
Source: California State Auditor generated based on data supplied by University of California Office of the President.
Although state support is a relatively small part of most campuses’ overall budget, large differences in funding sources can occur between campuses. For instance, as shown in Table 1, the Los Angeles campus had overall expenses of over $6 billion, with 7 percent of this amount—$454 million—coming from the state support that it receives. In contrast, the Santa Barbara campus had overall expenses of less than $1 billion, with almost 20 percent coming from state support.
Student Tuition at the University
The Master Plan originally affirmed California’s long-time commitment to the principle of tuition-free education for residents, but it acknowledged that students should pay fees for auxiliary costs like dormitories and recreational facilities. Beginning in 1970, the regents approved charging education fees of $150 and $180 for undergraduate and graduate students, respectively, to offset the cost of instruction. Since that time, the university has increased the education fee—now called base tuition—to $11,220 for the 2015–16 school year.
| Campus | Allocation of State Funds | Overall Expenditures | Allocation as a Percentage of Expenditures | Total Enrollment* |
|---|---|---|---|---|
| Merced | $114,200 | $261,800 | 44% | 6,268 |
| Santa Cruz | 159,500 | 664,500 | 24 | 17,866 |
| Santa Barbara | 177,300 | 945,400 | 19 | 23,051 |
| San Francisco | 186,000 | 4,554,600 | 4 | 4,904 |
| Riverside | 210,500 | 776,600 | 27 | 21,680 |
| Irvine | 249,200 | 2,439,000 | 10 | 30,757 |
| San Diego | 298,400 | 3,921,900 | 8 | 31,502 |
| Berkeley | 331,300 | 2,566,500 | 13 | 37,581 |
| Davis | 358,900 | 3,851,900 | 9 | 35,415 |
| Los Angeles | 454,400 | 6,172,600 | 7 | 43,239 |
Sources: California State Auditor’s analysis of data obtained from the University of California (university) Office of the President’s UC Information Center Enrollment Data Mart as well as the university’s 2014–15 Budget for Current Operations.
Note: Total per-campus allocation of state funds differs from the university’s total expenditures of state funds for fiscal year 2014–15 in Figure 2 because the latter amount includes expenditures not made by the campuses.
* Total enrollment is the student headcount as of the third week of the fall 2014 term and includes self-supporting students and medical residents.
Estimated Cost to Attend the University of California for a Resident Undergraduate Living on Campus, Academic Year 2015–16
| Personal/transportation | 2,400 |
Source: University of California website.
All students—residents and nonresidents—pay the same base tuition amount and student services fee. In addition, most students pay a number of other fees. For example, nonresidents pay a supplemental tuition amount. All students pay a health insurance charge unless they have private health insurance. Certain professional degree programs also charge a supplemental tuition amount for both residents and nonresidents. Lastly, campuses may charge campus‑based fees and course materials and service fees. As shown in the text box, the university estimates that the total cost for a resident undergraduates to attend in academic year 2015–16 was $33,600; a nonresident undergraduate paid the same amount plus $24,708 for nonresidential supplemental tuition. Table 2 briefly describes each charge.
The university has historically compared its tuition rates to those of four other public universities: the University of Illinois, Urbana‑Champaign; the University of Michigan; the University of Virginia; and the State University of New York, Buffalo. The publicly listed tuition and mandatory fees for academic year 2015–16 for the university and these four schools, in addition to 11 other similar public universities, are shown in Table 3.
| Type of Tuition or Fee | Description and Purpose of Charge | Academic year 2015–16 Annual Charges |
|---|---|---|
| Mandatory Systemwide Charges | ||
| Base Tuition |
|
$11,220 |
| Student Services Fee |
|
$1,020 |
| Nonresident Supplemental Tuition |
|
$12,245 to $24,708 |
| Variable Campus-Level Charges | ||
| Professional Degree Supplemental Tuition |
|
$4,200 to $40,476 |
| Campus-Based Fees |
|
$205 to $1,728 |
| Course Materials and Service Fees |
|
Variable |
| Health Insurance Charge |
|
$1,497 to $5,352 |
Sources: University of California tuition and fee schedules and its 2015–16 Budget for Current Operations.
Table 3 shows the tuition and fee amounts for both resident and nonresident undergraduates. For both types of students, the university’s tuition and fees are in the top half of the comparable public universities shown here. The university contends that other public universities charge varying amounts higher than the amounts shown in Table 3 for certain undergraduate majors. However, Table 3 lists the cost that each of the other universities publish on their websites for an undergraduate to attend.
| University | Annual Amount |
|---|---|
| Residents | |
| Pennsylvania State University* | $17,502 |
| University of Illinois, Urbana-Champaign† | 15,602 |
| University of Virginia | 14,468 |
| Rutgers | 14,000 |
| University of Michigan | 13,856 |
| Michigan State University | 13,612 |
| University of California | 13,400 |
| University of Washington | 10,770 |
| Indiana University, Bloomington | 10,388 |
| University of Oregon | 10,287 |
| Ohio State University | 10,037 |
| University of Texas at Austin | 9,816 |
| Texas A&M University | 9,428 |
| State University of New York, Stony Brook | 8,854 |
| State University of New York, Buffalo | 6,470 |
| University of Florida | 6,310 |
| Nonresidents | |
| University of Virginia | $43,764 |
| University of Michigan | 43,476 |
| University of California | 38,108 |
| Michigan State University | 36,412 |
| University of Texas at Austin | 34,860 |
| Indiana University, Bloomington | 33,740 |
| University of Washington | 33,072 |
| University of Oregon | 32,022 |
| Pennsylvania State University* | 30,452 |
| University of Illinois, Urbana-Champaign† | 30,228 |
| Rutgers University | 28,890 |
| Texas A&M University | 28,020 |
| Ohio State University | 27,365 |
| State University of New York, Stony Brook | 23,935 |
| University of Florida | 23,704 |
| State University of New York, Buffalo | 21,550 |
Sources: California State Auditor’s analysis of tuition data sourced from the universities’ respective websites. The University of California (university) amounts include base tuition, student services fee, the average cost of mandatory campus fees, and nonresident supplemental tuition, if applicable.
Note: Highlighted schools are the public universities that the university has historically used for comparison.
* Amount is for academic year 2014–15.
† Amount is for fall 2014.
The university’s revenue from tuition and fees has increased each year over the last 10 years, which the university attributes to enrollment growth and increases in tuition and fees. As Figure 3 shows, net tuition and fee revenues exceeded the support the university received from the State’s General Fund for the first time in its history in fiscal year 2010–11, a trend that has continued since that time.
Figure 3
The University of California’s Student Tuition and Fee Revenues Have Increased While Its State Appropriations Have Declined
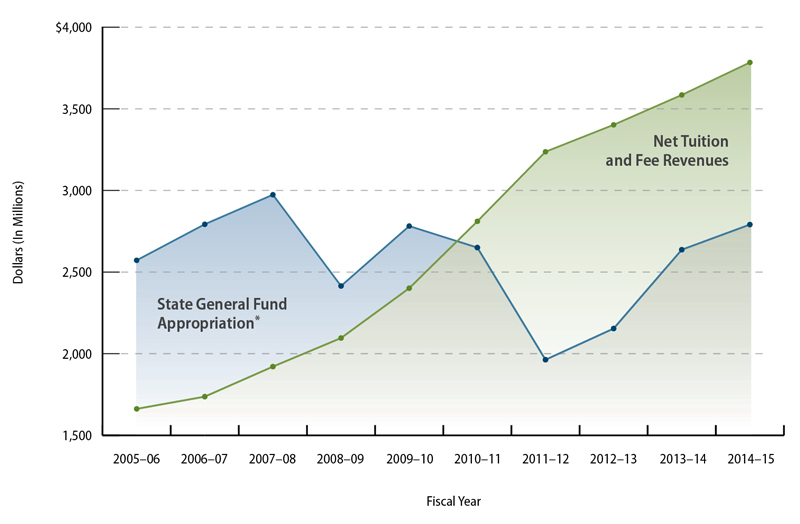
Source: University of California (university) annual audited financial statements.
Note: Tuition and fee revenues are from all students, net of financial aid.
* The State’s General Fund appropriation represents the amount the State appropriated to the university in the state Budget Act for each fiscal year less funding for certain activities, primarily debt service.
In recent years, drastic increases in the university’s nonresident enrollment have caused its revenues and expenditures of nonresident revenue to come under increased scrutiny by the Legislature, the Department of Finance (Finance), and the public. In particular, Finance stated that it has embarked on efforts to understand how the university spends tuition and fee revenues, particularly nonresident revenue. However, Finance asserted that it encountered difficulties in determining how the university spends tuition and fees because the university does not account for its expenditures in sufficient detail. In particular, the university’s spending of nonresident revenue is not distinguishable from its spending from other revenue sources in its financial documents—including its audited annual financial reports, campus financial schedules, and expenditure reports from the Governor’s Budget for fiscal year 2015–16—because it presents its spending by activity rather than revenue source.
Scope and Methodology
The Joint Legislative Audit Committee (audit committee) directed the California State Auditor to conduct an audit of the university’s budget process, nonresident enrollment, and executive compensation. The analysis the audit committee approved contained 12 separate objectives. We list the objectives and the methods we used to address them in Table 4.
| Audit Objective | Method | |
|---|---|---|
| 1. | Review and evaluate the laws, rules, and regulations significant to the audit objectives. | Reviewed relevant laws, regulations, and other background materials applicable to budget, enrollment, and executive compensation at the University of California (university). |
| 2. | Review and evaluate the recommendations for rebenching and the process by which the university developed the rebenching initiative. Determine how the university developed the weighted basis for distributing per-student funding, including to what extent the university consulted with stakeholders such as undergraduate and graduate students when developing rebenching recommendations. |
|
| 3. | Review and evaluate the university’s progress in the implementation of its “Rebenching and Funding Streams Initiatives” as well as any other initiatives that impact per‑student and campus funding. To the extent possible, determine if the university is on track to achieve its goal of leveling per-student funding by 2018. |
|
| 4. | Determine how much of state support funding is included in rebenching and identify how the university is using or distributing state support funding that is not included in rebenching. |
|
| 5. | Determine whether the university is sufficiently addressing per-student funding inequities at the campuses, particularly those campuses identified in the California State Auditor’s July 2011 audit report as having received the least funding but having the highest proportion of underrepresented students. |
|
| 6. | Review and evaluate the university’s methods for determining resident and nonresident enrollment targets at its campuses. Identify how the university determined the amount it charges nonresident students and assess how the amount compares to other comparable universities. |
|
| 7. | For the past 10 fiscal years, identify the trend and projections in nonresident enrollment and associated tuition. To the extent possible, determine the impact of nonresident enrollment on per-student funding, California resident student access to the UC campuses, and revenue received by the university and the campuses, including how any changes to admission standards have impacted resident students' access to the campuses of their choice. |
|
| 8. | Determine the level of outreach, including outreach to students in underrepresented communities and, to the extent possible, its impact on enrollment for nonresident versus California resident students for the past 10 fiscal years. In addition, determine the ethnic and racial background of the enrolled students. |
|
| 9. | For the most recent five fiscal years, review and evaluate how the university and the campuses have used the nonresident student tuition revenue. • Interviewed university staff to determine how each campus tracks and monitors nonresident supplemental tuition revenues and expenditures. |
|
| 10. | For the most recent five fiscal years, review the compensation packages for the top executive and management personnel at the university and each campus. Determine if any trends exist in the compensation packages identified, and to the extent possible, compare the university’s compensation packages to other public and private universities. |
|
| 11. | Evaluate the sufficiency of any changes made or corrective actions taken by the university in response to recommendations in the state auditor’s July 2011 audit report, including the status of any outstanding recommendations. |
|
| 12. | Review and assess any other issues that are significant to the audit. | Assessed the university's progress specific to its Working Smarter initiative. |
Sources: California State Auditor’s analysis of state law, planning documents, and information and documentation identified in the column titled Method.
Assessment of Data Reliability
The U.S. Government Accountability Office (GAO), whose standards we are statutorily required to follow, requires us to assess the sufficiency and appropriateness of computer-processed information that we use to support our findings, conclusions, or recommendations. In performing this audit, we obtained electronic data files extracted from the Office of the President’s Corporate Data Warehouse and from the Decision Support System for the purpose of calculating the number of employees and their gross earnings for fiscal years 2005–06 through 2014–15, reported as of September 30, 2015. We also obtained student admissions data for the 2005–06 through 2014–15 academic years and calculated various statistics related to student demographics and test scores for university applicants and admissions from the Office of the President’s Undergraduate Admissions System and other operational data. In addition, we obtained enrollment data from the Office of the President’s UC Information Center Enrollment Data Mart to calculate enrollment statistics based on the head count as of the third week of the fall term for academic years 2005–06 through 2014–15. We performed data-set verification procedures and electronic testing of key data elements and did not identify any significant issues.
We did not perform accuracy and completeness testing on any of these data because they are from partially paperless systems, and thus not all hard-copy documentation was available for review. Alternatively, following GAO guidelines, we could have reviewed the adequacy of selected system controls that include general and application controls. However, we did not conduct these reviews because the campuses are spread throughout the State, making such testing cost-prohibitive. Consequently, we determined that the university earnings, admissions, and enrollment data were of undetermined reliability for the purposes of this audit. Although this determination may affect the precision of the numbers we present, there is sufficient evidence in total to support our findings, conclusions, and recommendations.